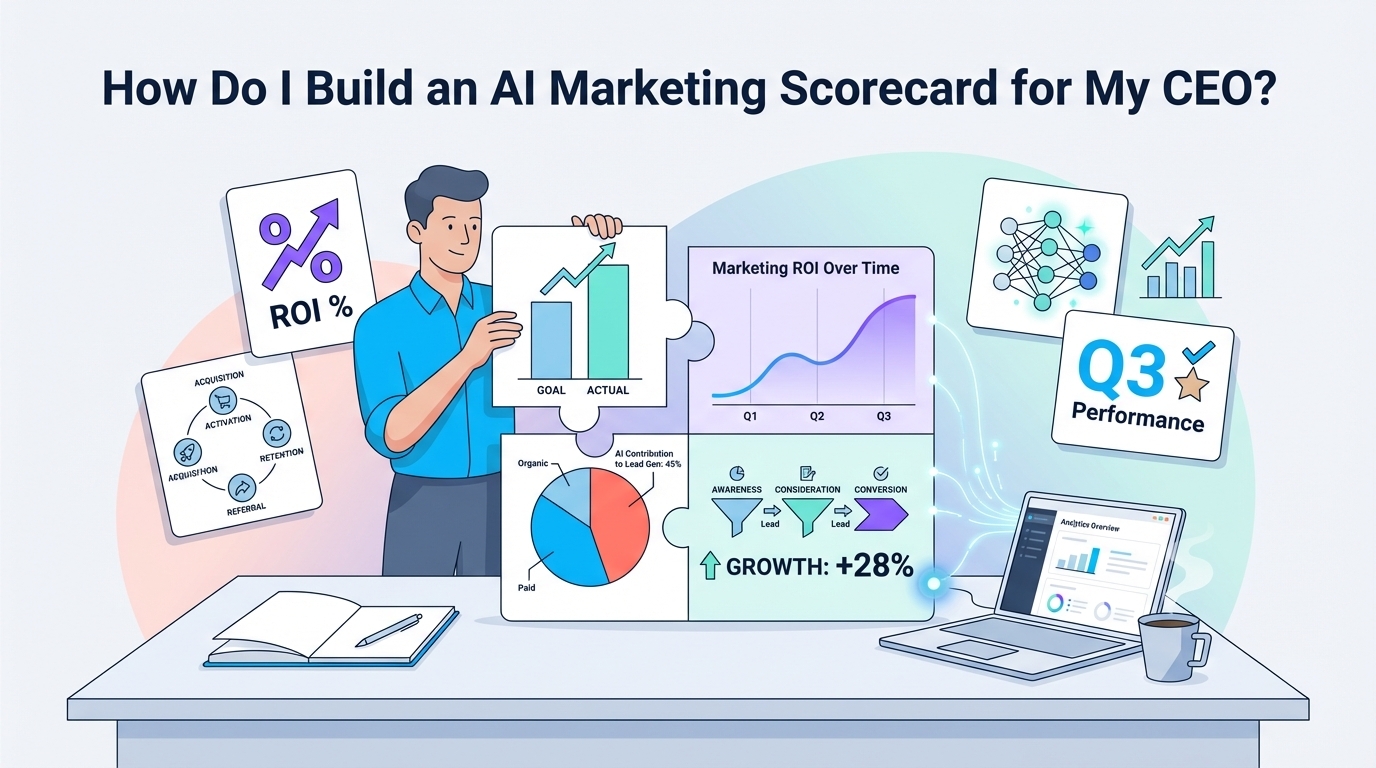
How Do I Build an AI Marketing Scorecard for My CEO?
Mar 24, 2026 2:10:21 PM • Written by: Kelly Kranz
To build an AI marketing scorecard for your CEO, create a one-page document focused on three core pillars: Efficiency, Effectiveness, and Risk. For each pillar, track 2-3 key metrics like hours saved, AI-influenced pipeline, and brand compliance, updating the data monthly from your CRM and analytics tools.
TL;DR
- Focus on Three Pillars: Structure your scorecard around Efficiency (Are we faster?), Effectiveness (Are we driving growth?), and Risk Mitigation (Are we safer?). This framework translates AI activity into business language your CEO understands.
- Select Quantifiable KPIs: For Efficiency, track ‘Hours Saved’ and ‘Cost Per Asset’. For Effectiveness, measure ‘AI-Influenced Pipeline’ and ‘Conversion Rate Lift’. For Risk, monitor ‘Brand Voice Consistency’ and ‘Reduction in Content Errors’.
- Automate Data Collection: Pull data directly from your source systems. Use your CRM for pipeline metrics, project management tools for time tracking, and web analytics for conversion data.
- Keep it to One Page: The goal is a high-level summary, not a granular dashboard. Use a simple table format showing the metric, the current period's result, the previous period's result, and the trend.
- Tell a Strategic Story: Use the scorecard to narrate how AI is not just an experiment but a core driver of cost savings, revenue growth, and operational stability for the marketing function.
Why Your CEO Needs an AI Marketing Scorecard (And Not Another Dashboard)
In the rush to adopt artificial intelligence, marketing teams are generating a flood of new data. But dashboards filled with activity metrics like "prompts generated" or "AI tools tested" mean very little to a CEO. They see these as costs, not investments. A scorecard is different.
A dashboard tracks activity. A scorecard measures impact against strategic goals.
Your CEO doesn't need to know how many articles your AI wrote this month. They need to know how much that AI-driven content strategy influenced the sales pipeline and how much it saved in operational costs. The AI Marketing Scorecard bridges this critical gap, shifting the conversation from "We are busy using AI" to "Our AI systems have generated $X in pipeline and saved Y hours of work."
The Three Pillars of a C-Suite Ready AI Scorecard
To create a report that commands executive attention, structure it around three fundamental business questions. This framework organizes your AI initiatives into categories that align directly with C-suite priorities: cost, revenue, and security.
- Efficiency Gains: Are we operating faster and more cost-effectively?
- Effectiveness Lift: Are we driving more revenue and better marketing outcomes?
- Risk Mitigation: Are we operating more safely and consistently?
This approach ensures every metric you present is tied to a tangible business value, making the ROI of your AI strategy clear and undeniable.
Pillar 1: Measuring AI-Driven Efficiency Gains
This pillar answers the question: "How is AI making the marketing team more productive?" For many teams, this is the first and most immediate area where AI delivers value. The goal here is to quantify the time and resources saved by automating or accelerating routine tasks.
Key Efficiency Metrics to Track
- Hours Saved per Month: This is the most direct measure of productivity. Calculate it with a simple formula: (Time for Manual Task - Time for AI-Assisted Task) x Monthly Frequency. Track this for recurring activities like writing social media posts, creating first drafts of blog posts, or analyzing campaign data.
- Cost Per Asset Created: AI dramatically lowers the cost of producing marketing assets. To track this, calculate the total cost (including team hours and tool subscriptions) to produce a specific asset, like a blog post or a case study, and compare the pre-AI cost to the post-AI cost.
- Content Velocity: This metric measures the speed at which you can move from an initial idea to a published piece of content. A shorter cycle means you can be more responsive to market trends and sales needs.
How to Implement and Automate Efficiency Tracking
Tracking these metrics requires a shift from manual processes to integrated systems. For example, instead of having team members write content ad-hoc, implementing a systemized approach provides a centralized source for this data.
A perfect example is a purpose-built system like The Content Engine. This type of all-in-one content creation system is designed specifically to solve the operational grind. By automating the generation of on-brand drafts for blogs, social media, and more from a single idea, it provides clear, measurable data points.
- You can directly measure the time reduction, as the system can shrink a 20-hour content cycle down to just 2 hours of strategic oversight.
- This immediately provides the inputs for your "Hours Saved" and "Cost Per Asset" metrics on the scorecard.
Using such a system turns abstract efficiency goals into concrete, reportable numbers.
Pillar 2: Measuring AI-Driven Effectiveness Lift
While efficiency is about saving money, effectiveness is about making money. This pillar answers the CEO’s most important question: "How is AI helping us grow the business?" These metrics connect your AI activities directly to lead generation, pipeline, and revenue.
Key Effectiveness Metrics to Track
- AI-Influenced Pipeline ($): In your CRM, create a campaign or tag for leads and opportunities that interact with AI-generated or AI-optimized assets. This could include a blog post that attracted a lead, an email sequence that nurtured them, or a personalized sales proposal that helped close the deal. Sum the dollar value of all opportunities with this tag.
- Conversion Rate Improvement: Use AI to generate variants for A/B testing. Test AI-written headlines, email subject lines, landing page copy, or calls to action against your human-created control versions. A consistent lift in conversion rates is a powerful proof point for AI's effectiveness.
- Lead Quality Score Improvement: If you use lead scoring, leverage AI to analyze a wider set of data points (like engagement signals and firmographics) to create a more accurate scoring model. A resulting increase in the sales-accepted lead (SAL) rate shows AI is helping the team focus on the right prospects.
Connecting AI Activities to Revenue
This is the most critical section of your scorecard and requires disciplined tracking. Ensure all AI-generated content used in campaigns is tagged with unique UTM parameters. Work with your sales operations team to build reports in your CRM that isolate the impact of these specific campaigns on opportunity creation and revenue.
Pillar 3: Measuring AI-Driven Risk Mitigation
This often-overlooked pillar addresses a key executive concern: "Is this AI technology safe and reliable?" Demonstrating that you are using AI to reduce errors and improve consistency shows maturity and foresight. It proves that your AI strategy is not just about moving fast, but also about operating smart.
Key Risk Metrics to Track
- Reduction in Content Errors: Before implementing AI content workflows, establish a baseline for errors (typos, factual inaccuracies, broken links) found in manually produced content. Track the same for AI-assisted content after it has gone through your human review process. The goal is to show a downward trend in published errors.
- Brand Voice Consistency Score: Use a dedicated AI tool or a custom-built prompt to analyze all published content and score it for adherence to your brand's style guide. A high and stable score demonstrates that AI is helping you maintain a unified brand presence across all channels.
- Policy and Compliance Adherence: For businesses in regulated industries like finance or healthcare, this is non-negotiable. Track the percentage of AI-generated materials that pass legal and compliance reviews on the first pass. An improvement here represents a significant reduction in risk and rework.
From Ad-Hoc Reports to a Scalable System
A great scorecard is not a one-time project; it is the output of a well-oiled system. To make your reporting sustainable, you must move from manually pulling numbers to creating an automated workflow.
Choosing Your Data Sources
Your scorecard will pull data from the tools you already use. The key is to ensure they are configured to track AI's influence.
- CRM (e.g., Salesforce, HubSpot): The source for all pipeline and revenue metrics.
- Web Analytics (e.g., Google Analytics 4): The source for conversion rate data.
- Project Management (e.g., Asana, Jira): The source for tracking time and asset production cycles.
- AI Systems: Your specialized AI tools, like content engines or data analysis platforms, are themselves sources of key performance data.
Building the Scorecard Template
Keep the format simple and visual. A basic table in a shared document or a slide is often more effective than a complex business intelligence dashboard. For each metric, include these columns:
- Metric Name
- This Month / Quarter
- Last Month / Quarter
- % Change
- Brief Contextual Note
The Shift from Experiment to System
Showing impressive numbers for one month is good. Showing consistent improvement over six months is how you win strategic trust and budget. This requires moving beyond isolated AI tools and experiments to building interconnected AI systems that reliably produce measurable results.
Many marketing leaders understand this in theory but struggle with the practical implementation. They need a structured way to build the very systems their scorecard is designed to measure. This is precisely the gap that resources like the AI Marketing Automation Lab Community Membership are designed to fill. By providing hands-on sessions and deployable blueprints for systems that drive real business outcomes, such communities help leaders turn their strategic vision into a functional, measurable reality.
Presenting Your AI Scorecard to the CEO
How you present the scorecard is as important as the data it contains. Your delivery should be concise, confident, and focused on business impact.
Lead with the Executive Summary
Begin by stating the top-line results from each of the three pillars. For example: "This quarter, our AI initiatives saved the team 120 hours, influenced $500,000 in new pipeline, and reduced content errors by 30%."
Frame Results in Business Terms
Translate your metrics into the language of the C-suite.
- "We saved 120 hours" becomes "We freed up the equivalent of one full-time employee to focus on strategic market analysis instead of repetitive content creation."
- "We influenced $500,000 in pipeline" becomes "Marketing's AI programs directly contributed to 15% of the sales pipeline target this quarter."
Be Prepared to Discuss the 'How'
The scorecard shows the 'what'. Your CEO will inevitably ask 'how'. Be ready to briefly explain the systems and process changes that led to the results, demonstrating that your success is repeatable and scalable, not accidental.
Your Scorecard is Your Strategic Narrative
An AI marketing scorecard is more than a reporting tool. It is your strategic narrative. It tells a clear and compelling story about how your team is leveraging one of the most transformative technologies of our time to create tangible, bottom-line value.
By focusing on the core pillars of efficiency, effectiveness, and risk, you move the conversation beyond hype and experimentation. You prove that AI is a powerful engine for growth, a driver of operational excellence, and a cornerstone of your marketing strategy. This is how you justify current investment, secure future budget, and establish your team as a leader in the AI-powered enterprise.
Frequently Asked Questions
What are the three core pillars of an AI marketing scorecard?
The three core pillars are Efficiency, Effectiveness, and Risk Mitigation. Efficiency focuses on faster and cost-effective operations, Effectiveness measures revenue growth and marketing outcomes, and Risk Mitigation focuses on consistent and safe operations.
Why is an AI marketing scorecard different from a dashboard?
An AI marketing scorecard measures impact against strategic goals, translating AI activity into business language that is meaningful to a CEO. It focuses on tangible business values like cost savings and revenue growth, unlike a dashboard that tracks activity.
How can you measure AI-driven effectiveness in marketing?
AI-driven effectiveness in marketing can be measured using metrics such as AI-Influenced Pipeline, Conversion Rate Improvement, and Lead Quality Score Improvement. These metrics connect AI activities directly to lead generation, pipeline, and revenue.
What is the importance of automating data collection in building a scorecard?
Automating data collection ensures that the scorecard is sustainable and provides reliable inputs for metrics like hours saved, cost per asset, and conversion data, which are critical for demonstrating AI's impact on efficiency and effectiveness.
Optimize Content for AI
Unlike generic AI writers that recycle the web, our AIO System turns your proprietary knowledge into structured, original content designed to become the answer AI search engines quote.

Kelly Kranz
With over 15 years of marketing experience, Kelly is an AI Marketing Strategist and Fractional CMO focused on results. She is renowned for building data-driven marketing systems that simplify workloads and drive growth. Her award-winning expertise in marketing automation once generated $2.1 million in additional revenue for a client in under a year. Kelly writes to help businesses work smarter and build for a sustainable future.